Definitions
Now, what are these numbers? Many people will give you a technical description that can be hard to grasp and make your eyes glaze over the minute you hear them. But the reality is simple.
The Unemployment Rate is the percentage of:
PEOPLE WHO WANT A JOB BUT DON'T HAVE ONE (Unemployed)/
LABOR FORCE
The Labor Force is:
PEOPLE WHO WANT AND HAVE JOBS (Employed) + PEOPLE WHO WANT A JOB BUT DON'T HAVE ONE AND ARE LOOKING FOR ONE (Unemployed)
The Labor Force Participation Rate is percentage of:
[PEOPLE WHO WANT AND HAVE JOBS (Employed) + PEOPLE WHO WANT A JOB BUT DON'T HAVE ONE AND ARE LOOKING FOR ONE (Unemployed)]/
WORKING AGE PEOPLE
Working Age People are generally defined as PEOPLE WHO ARE 16 YEARS AND OLDER. In reality, they are:
[PEOPLE WHO WANT AND HAVE JOBS (Employed) + PEOPLE WHO WANT A JOB BUT DON'T HAVE ONE AND ARE LOOKING FOR ONE (Unemployed) + PEOPLE WHO ARE NOT IN THE LABOR FORCE (Not in Labor Force)]
The category PEOPLE WHO ARE NOT IN THE LABOR FORCE includes:
PEOPLE WHO ARE IN THE MILITARY
PEOPLE WHO ARE INSTITUTIONALIZED
PEOPLE WHO ARE STUDENTS
PEOPLE WHO ARE HOMEMAKERS
PEOPLE WHO ARE RETIRED
PEOPLE WHO ARE MARGINALLY ATTACHED TO LABOR FORCE (INCLUDING DISCOURAGED WORKERS)
The Employment to Population Ratio is the percentage of:
PEOPLE WHO WANT AND HAVE JOBS/
WORKING AGE PEOPLE
In other words, PEOPLE WHO WANT AND HAVE JOBS/
[PEOPLE WHO WANT AND HAVE JOBS + PEOPLE WHO WANT A JOB BUT DON'T HAVE ONE AND ARE LOOKING FOR ONE + PEOPLE WHO ARE NOT IN THE LABOR FORCE
How does this work out?
According to this chart from the popular financial blog, Calculated Risk, the US, in May 2014, gained back all the jobs lost since the Great Recession started in November 2007.

But this is deceptive. For one, the working age population of the US grew by 15.795 million people or 6.81% from 2007 to May 2014, while the labor force grew by 2.489 million people or only 1.63% during the same period. The number of employed persons actually shrank by 233,000 people and unemployed people grew by 2.721 million people or 38.44% during the same period. People Not in the Labor Force grew by 13.266 million or 16.85% during the same period.
| United States | ||||||||||
| Employment Situation | ||||||||||
| In Thousand Persons | ||||||||||
| 2007 to May 2014 | ||||||||||
| 2007 | 2008 | 2009 | 2010 | 2011 | 2012 | 2013 | May 2014 | Variance | % Variance | |
| Civilian Non Institutional Population | 231,867 | 233,788 | 235,801 | 237,830 | 239,618 | 243,284 | 245,679 | 247,662 | 15,795 | 6.81% |
| Labor Force | 153,124 | 154,287 | 154,142 | 153,889 | 153,617 | 154,975 | 155,389 | 155,613 | 2,489 | 1.63% |
| Employed | 146,047 | 145,362 | 139,877 | 139,064 | 139,869 | 142,469 | 143,929 | 145,814 | -233 | -0.16% |
| Unemployed | 7,078 | 8,924 | 14,265 | 14,825 | 13,747 | 12,506 | 11,460 | 9,799 | 2,721 | 38.44% |
| Not in Labor Force | 78,743 | 79,501 | 81,659 | 83,941 | 86,001 | 88,310 | 90,290 | 92,009 | 13,266 | 16.85% |
Source: bls.gov
For the United States, the headline Unemployment Rate has dropped down significantly, from a peak of 9.9% in 2009 to just 6.3% as of May 2014. The Labor Force Participation Rate continues to drop and is now at 62.8% - levels not seen since the late 1970's when women started entering the workforce in droves. The Employment to Population Ratio has only recovered marginally from its recessionary low of 58.3% to just 58.9% in May 2014. It is nowhere near its pre-recession average. In other words, job growth has been growing only barely faster than the growth in the working age population.

Economists have attributed to this phenomenon to increased retirements among the elderly. But the Bureau of Labor and Statistics itself is projecting large increases in the Labor Force Participation Rate among people aged 65 and older. The reality is fewer people can afford to retire.

Regional Comparison
So how does the DELMARVA + DC Region stack up to the rest of the United States?
Delaware

The state of Delaware is in a funk, employment-wise. Its Labor Force Participation Rate, at 60.8% as of May 2014, is even lower than the 62.7% Labor Force Participation Rate the state registered in 1976, the earliest available BLS.Gov data. Although its Unemployment Rate has dropped from a peak of 8.0% in 2010, to just 5.9% as of May 2014, its Employment to Population Ratio, at 57.2% as of May 2014, is still hovering near the bottom at 56.7% in 2013.
Maryland
Like Delaware, Maryland's Labor Force Participation Rate continues to trend lower, hitting 66.7% as of May 2014 - levels not seen since the late 1970s. Its Employment to Population Ratio has yet to bottom out. At 62.9% as of May 2014, it is reaching levels not seen since the early 1980s. Its Unemployment Rate, however, has dropped sharply, from a peak of 7.9% as of 2010 to just 5.6% as of May 2014. As the previous data indicates, much of the drop has come from people dropping out of the labor force altogether.

Virginia
Virginia has seen a sharp uptick in its labor force participation rate, from a post-recessionary bottom of 66.4% in 2013, to 67.4% as of May 2014. Likewise, its Employment to Population Ratio has improved to 63.9% as of May 2014. Unemployment Rate has dropped from its 2010 peak of 7.1% to just 5.1% as of May 2014.

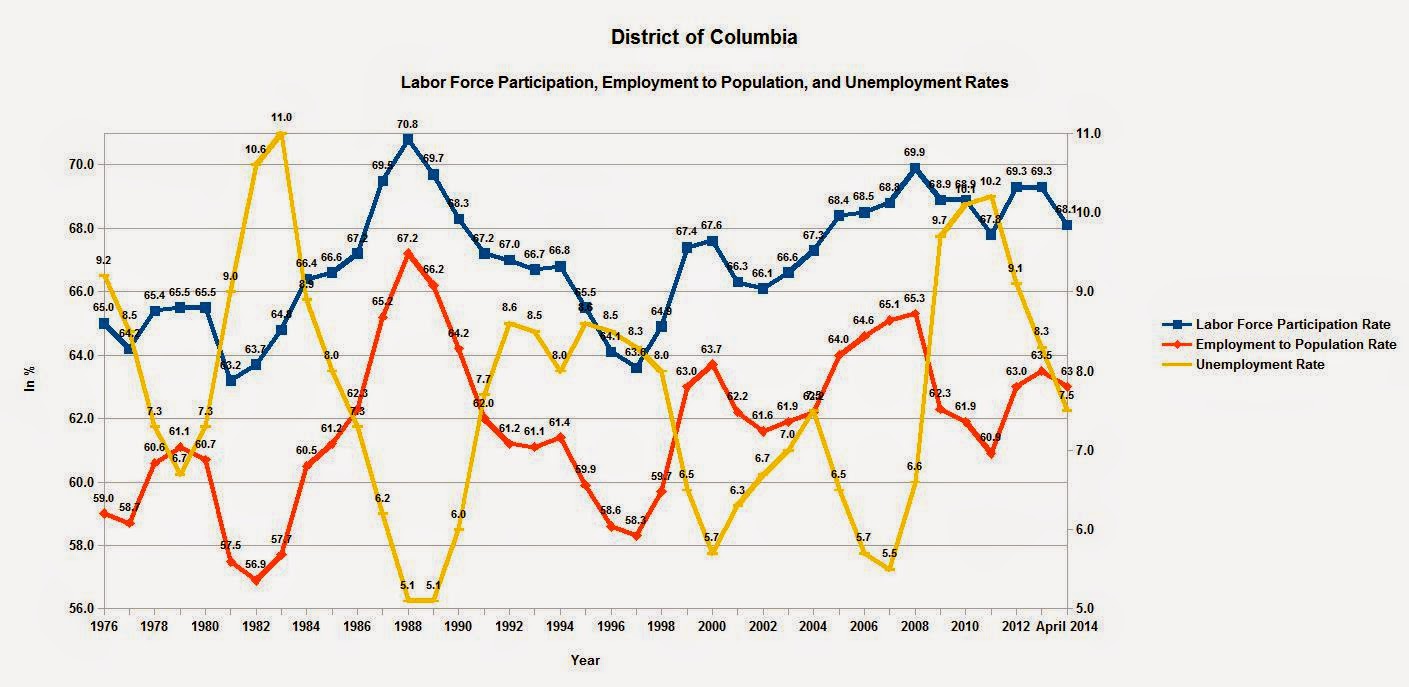
District of Columbia
The District of Columbia's Labor Force Participation bottomed out at 67.8% in 2011, bounced up to the 69.3% level for 2012 and 2013 and is down again to 68.2% as of May 2014. Its Employment to Population Ratio bounded up sharply from a low of 60.9% as of 2011 to 63.5% as of 2013 and now stands at 63.0% as of May 2014. Its Unemployment Rate, which reached a peak of 10.2% as of 2011, now stands at 7.5% as of May 2014.