Search This Blog

Friday, July 21, 2017

A Tale of Two Markets: China vs. Hong Kong Residential Real Estate

Home Prices in China, as measured by Shanghai Home Prices, have recently begun to plateau, signifying a possible slowdown in the real estate sector for 2017. 

 \

Hong Kong Home Prices have resumed their upward trend after dipping in 2016 and have hit new highs as of the first quarter of 2017.

Both real estate markets have surpassed their inflation adjusted levels by a very wide margin.

What happens next is anyone's guess. Stay tuned.

Related Links:

How low can Hong Kong Property Prices Go? Some Clues from the Not Too Distant Past.

After a 10% Market Decline in Late 2015 to Early 2016, Hong Kong Home Prices Resume Their Relentless Upward Trend in late 2016


Friday, July 14, 2017

The (Un)Steady State of Philippine Real Estate in 2016


At 109.77%, 8990 Holdings still has the most Real Estate Receivables relative to its Stockholder's Equity in 2016. Next is Century Properties at 70.49% of Stockholder's Equity, followed by Ayala Land at 46.92% of Stockholder's Equity.


Naturally, 8990 Holdings still has the most problematic Real Estate Receivables. Problem Real Estate Receivables amount to 11.10% of its Stockholder's Equity as of 2016. Believe it or not, this figure is way down from the 20.40% it posted in 2015.  Ayala Land's Problem Real Estate Receivables amount to 6.72% of its Stockholder's Equity in 2016. Neck and neck for third place are SM Prime Holdings and SM Investments with Problem Real Estate Receivables amounting to 3.68% and 3.61% of their respective Stockholder's Equity.

 SM Prime Holdings also holds the dubious distinction of having the highest percentage of Past Due But Not Impaired Real Estate Receivables relative to Total Real Estate Receivables in 2016. This is closely followed by Ayala Land with 14.63% of its Real Estate Receivables in Past Due status. Both Vista Land and 8990 Holdings have similar ratios with 9.58% (Vista Land) and 9.44% (8990 Holdings) of its Real Estate Receivables falling Past Due in 2016.


Related Posts:

Ayala Land's Real Estate Receivables Problem Has Gotten Worse, Not Better

8990 Holdings Inc.'s 2016 Annual Report: What a Difference an Auditor Makes!

8990 Holdings Inc.'s Impaired Installment Contracts Receivable (ICRs): The Pig Has Finally Broken Out of the Python!

The Philippine Real Estate Bubble Has Also Burst For... Ayala Land!

The Philippine Real Estate Bubble Has Also Burst for Vista Land

The Philippine Real Estate Bubble Has Already Burst for HOUSE (8990 Holdings, Inc.)

Friday, July 7, 2017

The Unbearable Volatility of BSP's Residential Real Estate Price Index

Perhaps because the index has been in its infancy but according to BSP's Residential Real Estate Price Index (RREPI) investors in residential real estate have been experiencing a nausea-inducing roller-coaster ride in terms of asset prices.

The swings in the areas outside the National Capital Region (Ex-NCR) are particularly problematic. Within the past two years, RREPI - All Types for the Ex-NCR area has swung from a high of 125.7 in the second quarter of 2016 from a low of 106.2 as of the 2nd Qtr. of 2015, an increase of 15.51% in just one year. Then in the next quarter, the index drops by 10.74% to 112.2 as of the 3rd Qtr of 2016. The RREPI - All Types index for the Ex-NCR area now rests at 116.8 as of the 1st Qtr 2017 or 4.10% higher than what it was just two quarters ago.


This volatility of the Ex-NCR RREPI-All Types has influenced large swings in the overall Philippine RREPI-All Types. Since its inception, the nationwide index has swung 10.18% from bottom to top. No doubt, the volatility of the Philippine-wide RREPI-All Types was tempered by the low volatility of the NCR RREPI - All Types, which fluctuated by only 2.63% from peak to trough.

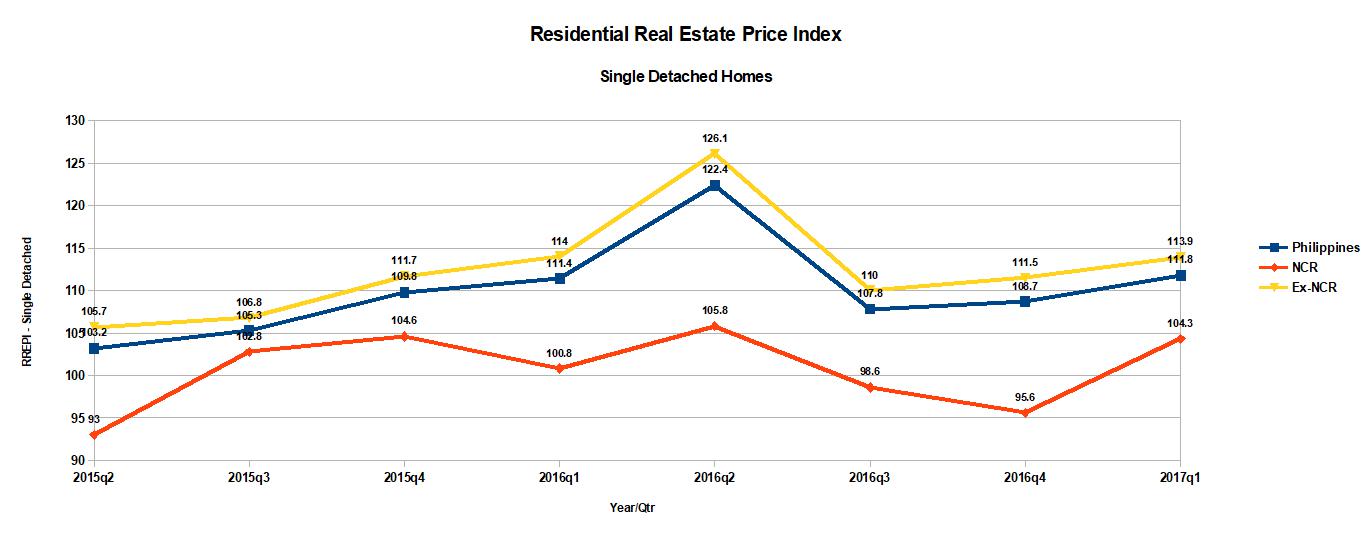
The same dynamic has been playing out as you drill down into the index's sub-sectors, whether they be Single Detached Homes, Duplex, Townhouses, or Condominiums. Ex-NCR is volatile while NCR has smoother fluctuations, leading to a more volatile nationwide index for each sub-sector.


The Philippines was one of the last countries in the ASEAN to institute a National Residential Real Estate Index. Other countries have done this much sooner. However, late is better than never. In the meantime, for planning purposes, the index has limited utility.

Tuesday, July 4, 2017

Great Depression vs. Great Recession GDP Growth Rates - Third Estimate of the First Quarter of 2017

Last Thursday, June 29, 2017, the Bureau of Economic Analysis released their third estimate of 2017's first quarter GDP growth rate: 1.40%. For the fourth quarter of 2016, GDP grew by 2.1%.


The economic recovery from the Great Recession has been downright sluggish, never taking off beyond the 3.00% growth rate that signals a robust economic recovery and always flirting with the 1.00% growth rate that signals a stalling economy.


On a nominal basis, the economy is 31% larger than what it was ten years ago. In real terms, it's just 13% larger.


On a per capita basis, real GDP grew by only 5.34% for the past ten years, for a compounded annual average growth rate of only 0.52% per annum - far less than the so-called "Hindu Rate of Growth" threshold of 1.30% per annum. This growth rate is so slow that it is almost imperceptible.


To top it all, the growth has not been evenly distributed. As of year-end 2015, Real Median Household Income stood at $56,516 or 1.58% below the Real Median Household Income of $57,423 in 2007 and 2.41% below that of 1999 ($57,909). Almost all the gains in the economy have been going to the upper echelons of US society.