Search This Blog

Friday, December 7, 2018

Which US State Has the Most Livable Minimum Wage? The Answers May Surprise You.

People in the US have often lamented how the cost of living has outstripped the federal minimum wage, which has remained stuck at $7.25 per hour since July 24, 2009.


Wages have severely  lagged labor productivity by a wide margin. Had wages kept up with productivity growth, wages would be closer to $33 an hour than the current $7.25 per hour. Much of the gains in productivity have gone to capital rather than labor, resulting in increasing income inequality.


MIT has a neat Living Wage Calculator to help people estimate the cost of living in a person's community or region. Based on their calculations, the weighted average (given the Civilian Non-Institutional Population in each state) living wage for the entire US is $12.08 per hour. This is almost 40% higher than the weighted average minimum wage of $8.71 per hour for the entire USA and more than twice the national poverty wage of just $5.71 per hour.


MIT 2017 Living Wage
By State
In US$ per Hour


State MIT Living Wage Federal Poverty Wage Federal Minimum Wage
Alabama $11.14 $5.80 $7.25
Alaska $12.48 $7.24 $9.84
Arizona $11.22 $5.80 $10.50
Arkansas $10.38 $5.80 $8.50
California $14.01 $5.00 $11.00
Colorado $12.47 $5.80 $10.20
Connecticut $12.88 $5.80 $10.10
Delaware $12.44 $5.80 $8.25
District of Columbia $17.11 $5.80 $12.50
Florida $11.75 $5.80 $8.25
Georgia $11.93 $5.80 $7.25
Hawaii $15.39 $6.66 $10.10
Idaho $10.64 $5.80 $7.25
Illinois $12.50 $5.80 $8.25
Indiana $10.70 $5.80 $7.25
Iowa $10.53 $5.80 $7.25
Kansas $10.69 $5.80 $7.25
Kentucky $10.49 $5.80 $7.25
Louisiana $10.91 $5.80 $7.25
Maine $11.60 $5.80 $10.00
Maryland $14.62 $5.80 $9.25
Massachusetts $13.39 $5.80 $11.00
Michigan $10.87 $5.80 $9.25
Minnesota $11.53 $5.80 $9.65
Mississipi $10.86 $5.80 $7.25
Missouri $10.76 $5.80 $7.85
Montana $10.95 $5.80 $8.30
Nebraska $10.60 $5.80 $9.00
Nevada $10.94 $5.80 $8.25
New Hampshire $12.01 $5.80 $7.25
New Jersey $13.72 $5.80 $8.60
New Mexico $10.98 $5.80 $7.50
New York $14.42 $5.80 $10.40
North Carolina $11.36 $5.80 $7.25
North Dakota $10.89 $5.80 $7.25
Ohio $10.47 $5.80 $8.30
Oklahoma $10.52 $5.80 $7.25
Oregon $12.48 $5.80 $10.25
Pennsylvania $11.11 $5.80 $7.25
Rhode Island $12.10 $5.80 $10.10
South Carolina $11.17 $5.80 $7.25
South Dakota $10.03 $5.80 $8.85
Tennessee $10.44 $5.80 $7.25
Texas $11.03 $5.80 $7.25
Utah $11.22 $5.80 $7.25
Vermont $12.32 $5.80 $10.50
Virginia $13.86 $5.80 $7.25
Washington $12.28 $5.80 $11.50
West Virginia $10.68 $5.80 $8.75
Wisconsin $11.03 $5.80 $7.25
Wyoming $10.63 $5.80 $7.25
National USA $12.08 $5.71 $8.71


Based on these figures, the gap between the minimum wage and living wage for each state is the highest in Virginia, where the minimum wage of $7.25 per hour is just 52% of a statewide living wage of $13.86 per hour. The state of Washington has the most livable minimum wage. Its statewide minimum wage of $11.50 per hour is more than 90% of its computed living wage of $12.28 per hour.

State Minimum Wage/Living Wage
Washington 93.65%
Arizona 93.58%
South Dakota 88.24%
Maine 86.21%
Vermont 85.23%
Michigan 85.10%
Nebraska 84.91%
Minnesota 83.69%
Rhode Island 83.47%
Massachusetts 82.15%
Oregon 82.13%
West Virginia 81.93%
Arkansas 81.89%
Colorado 81.80%
Ohio 79.27%
Alaska 78.85%
California 78.52%
Connecticut 78.42%
Montana 75.80%
Nevada 75.41%
District of Columbia 73.06%
Missouri 72.96%
New York 72.12%
Florida 70.21%
Tennessee 69.44%
Kentucky 69.11%
Oklahoma 68.92%
Iowa 68.85%
New Mexico 68.31%
Wyoming 68.20%
Idaho 68.14%
Kansas 67.82%
Indiana 67.76%
Mississipi 66.76%
North Dakota 66.57%
Louisiana 66.45%
Delaware 66.32%
Illinois 66.00%
Texas 65.73%
Wisconsin 65.73%
Hawaii 65.63%
Pennsylvania 65.26%
Alabama 65.08%
South Carolina 64.91%
Utah 64.62%
North Carolina 63.82%
Maryland 63.27%
New Jersey 62.68%
Georgia 60.77%
New Hampshire 60.37%
Virginia 52.31%

Source: MIT Living Wage Calculator

What Is the National Living Wage?

Wednesday, December 5, 2018

Maybe Filipinos Are Getting Richer, More Filipinos Are Studying in the USA as of 2017-2018

Maybe Filipinos are getting richer. More of them are studying in the USA. After almost eight years of declining enrollment, the number of Filipinos studying in the USA has started trending up. At 3,225 students, enrollment at US educational institutions is almost 12% higher than the bottom of 2015, when 2,886 Filipinos enrolled. This is still almost 24% below the 2008 peak of 4,225.


We are finally joining our ASEAN neighbors, particularly Vietnam, whose students are enrolling in US universities in ever greater numbers.


If Filipinos Are Getting Richer, Why Are There Fewer Filipino Students in the USA Every Year? - Updated as of 2016-2017

Friday, November 30, 2018

Philippine Public Construction as a % of GDP is at a 20 Year High! - As of September 30, 2018

Philippine Public Construction is way above its historical trend of 3.40% of GDP. As of the third quarter of 2018, Philippine Public Construction Gross Value as a percentage of GDP hit 4.15%. This is the highest ratio since 1998.

This boost in public construction, particularly in infrastructure, has led to the first cumulative overhang since 2003. 


As long as infrastructure spending is not done in white elephants, such as China's famous bridges to nowhere, this bodes well for the Philippine economy because the fiscal multiplier from such projects is very significant and will increase efficiencies in the entire Philippine economy.

Wednesday, October 3, 2018

Great Recession vs. Great Depression: The GDP Growth Rate Is Finally Speeding Up!

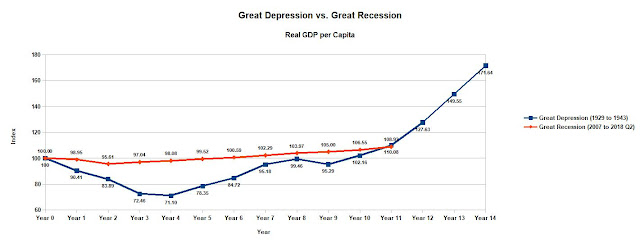
Two months ago, we lamented on how the economic recovery of the Great Recession had become officially much slower than that of the Great Depression. Last week, the Bureau of Economic Analysis released an advance estimate of the GDP growth rate for the second quarter of 2018.  The good news? It's finally at 4.2%, a rate not seen since the third quarter of 2014.


On a Nominal GDP Per Capita basis, the economic recovery of the Great Recession is still way ahead of the Great Depression. The dip in nominal GDP per capita was really shallow - less than 3 percentage points. The drop in GDP per capita during the Great Depression was a catastrophic 47%.

At this point in the economic recovery, some eleven years after the Great Recession started, we are almost 30% better than where we were. Whereas during the Great Depression, nominal GDP per capita remained almost 10% below the depression's inception.


In terms of real GDP per capita, people were made whole only on 2013 of the Great Recession. Five years later, we are only 9% better than where we were in 2013.  During the Great Depression, people were only made whole, in terms of Real GDP Per Capita, only on year 10 of the Great Depression. But the recovery accelerated even faster. Just one year later, people were 8% better. That trend will accelerate in year 12 - by then, they will be almost 18% better than they were just one year earlier. Now where will we be one year from now? We don't know. So far, we are faring better than people of  the Great Depression, but just barely.


Tuesday, September 25, 2018

Construction Gross Value as a Percentage of GDP Is Near All Time Highs! - Updated as of 2nd Qtr 2018

Last May 4, 2015, we noted that Construction Gross Value (Construction GV) at 11.21% as of the year-end 2014 was already well above its historical average of 9.59% of GDP since 1990.  This ratio has run at an above average rate since 2009 and has already eaten away at the "cumulative underhang" or underinvestment in construction that has taken place since 2004, when the excessive investment in construction that took place in the mid to late 1990's was being absorbed.


As of the 2nd Qtr of 2018, Construction GV as a percentage of GDP now stands higher at 13.58% of GDP - up from an all-time high of 12.61% posted in 2016. But the real story is that Cumulative Construction GV has gone well above equilibrium and now stands at 6.8% above equilibrium.  Given all the planned new projects that are already at the execution stage, the momentum in Construction Investment will continue.


Private construction as a percentage of GDP seems to have leveled off from its all time high. As of 2018 Q2, this ratio now stands at 8.97% of GDP, down from a high of 9.23% of GDP as of 2016.


The overhang in private construction continues to climb. It's now 5.16% of GDP as of the 1st Half of 2018.


So what's driving the overall upward momentum? Two words: Public Construction. Public construction gross value jumped substantially in the 1st half of 2018. It's now 4.61% of GDP, way above any level it has seen in the last 20 years.


Based on the graph of the cumulative overhang in public construction gross value, the Philippines seems to have been substantially underinvesting in public infrastructure from 2010 to 2017. The overhang now stands at 0.90% of GDP - levels not seen since the 1990's.


This bodes well for the country because a massive uptick in public construction usually involves public infrastructure, whose multiplier effect is substantially more than private construction. For example, a bridge or road benefits the general population, while a residential building or mall usually just benefits tenants and consumers within the locality.

Moreover, as private construction ticks down, public construction is poised to pick up the slack and maintain the GDP growth of the country.


Construction Gross Value as a Percentage of GDP Is Near All Time Highs! - Updated as of 1st Qtr 2018

Tuesday, September 18, 2018

There Are Still Almost 8 Million Missing American Workers

Last time we talked about this, there were 7.95 million missing American workers, if we used the Pre-Recession 2007 Labor Force Participation Rate (LFPR) of 65.70%.

As of August 2018, that figure hasn't changed much. There are still 7.77 million missing American workers, if we used the 2007 LFPR. The LFPR now stands at 62.70% as of August 2018, just 0.10% higher than the LFPR at the end of 2017.


Using the Pre-Recession 2007 Civilian Employment Population Ratio (EPR) of 63.00% leaves similar results: 7.04 million missing American workers. The EPR now stands at 60.30% as of August 2018, 0.70% higher than the EPR at the end of 2017.


It will take a long time for this slack to be reduced. The LFPR only bottomed out to 62.40% in 2015 and has climbed only 0.10% every year since then. Thus, it will take a staggering 31 years to cover the 3.10% gap in the LFPR.

 Therefore the US will continue to experience little to no wage inflation in the near future.

Related: Why There Will Be Little to No Wage Inflation: There are 8 Million Missing American Workers


Monday, September 10, 2018

According to the BSP, Philippine Real Estate Prices in 2018 Q1 Posted Gains but Single Detached Homes Declined

According to the BSP's Residential Real Estate Price Index (RREPI), residential real estate prices for the entire Philippines (All Types) increased by 2.11% year-on-year (yoy). Most of the increase took place in the NCR region, which increased by 2.70% yoy in 2018 Q1.  Ex-NCR increased by just 0.90% yoy for the same period.


The prices for Single Detached Homes in the NCR declined by a substantial 5.33% year over year, from 91.9 as of the first quarter 2017 to 87.0 as of the first quarter of 2018. Ex-NCR prices for Single Detached Homes decllined by -0.37% for same time period. On an overall basis, prices for Single Detached Homes declined by -0.56% year over year.


Duplex prices increased very substantially. NCR prices increased by 465.77% for the year leading up to the first quarter of 2018. For Ex-NCR, the increase in duplex prices was much more muted, only 4.16% year on year for the same period. Overall, Philippine duplex prices rose by 44.19% year on year, from 91.2 in 2017 Q1 to 131.5 as of 2018 Q2.


Townhouse prices also increased substantially year on year. NCR townhouses increased in price by 9.06% for the year. Ex-NCR townhouses increased by 15.64% for the same period. Overall, Philippine townhouse prices increased by 7.26% year on year to reach 122.4 in 2018 Q1, up from 107.7 in 2017 Q1.


Condominiums were another bright spot in the residential real estate sector. Throughout the Philippines, prices gained 2.03% year-over-year. The gains were primarily due to NCR condominiums, which rose 3.31% year-over-year. Ex-NCR condominium prices declined by -3.13% in one year.


How reliable are these trends? BSP's Residential Real Estate Price Index (RREPI) is relatively new, having begun only in the second quarter of 2015. So, it's a little over two years old and the results have been volatile. The kinks in the statistics will, hopefully, over time, be worked out.
Read: The Unbearable Volatility of BSP's Residential Real Estate Price Index


Friday, September 7, 2018

What's fueling the Nativist Anti-Immigrant Movement: Almost Half the Jobs Added Have Gone To Foreign Born Workers

You read that right.

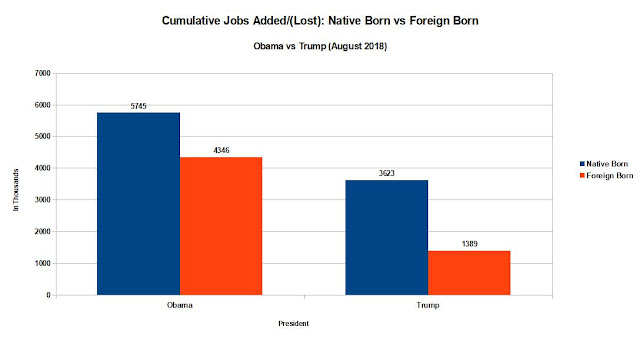
Half the cumulative jobs added since the start of the Great Recession have gone to foreign born workers. As of August 2018, 4,006 jobs added went to the foreign born while native born workers accumulated only additional 4,415 jobs. This happened despite the fact that foreign born workers only amount to 14.80% of the Total Civilian Non-Institutional Population - the population eligible to work.

In other words, much of the economic recovery went to the foreign born while a significant chunk of those who disappeared from the workforce are native born.


Much of this took place during the eight years of the Obama presidency when native born workers gained 6 million jobs and foreign born workers gained over 4 million jobs.


A lot of the gains for native born workers happened in the later years of the Obama presidency. Indeed, when Trump announced his presidential candidacy in May 2015, native born workers had gained around only 237 thousand jobs while foreign born workers had gained almost 2 million jobs.


Since Trump assumed the presidency in January 2017, native born workers have gained an additional  4 million jobs while foreign born workers gained over 1 million jobs.

Sources: St. Louis Federal Reserve

Related Post: How Trump Became Triumphant: His Nativist Anti-Immigration Rhetoric Has Struck a Chord with Many Americans


Wednesday, September 5, 2018

Are ASEAN House Prices Accelerating? The Blow Off Top Continues as of Q2 2018

Almost all countries discussed in this blog post, with the exception of Thailand, have been experiencing rapid growth in home prices that have outstripped inflation by a wide margin.  The gap between home prices and their inflation adjusted levels are at the widest ever, particularly in Singapore, Hong Kong, and the Philippines.

Singapore

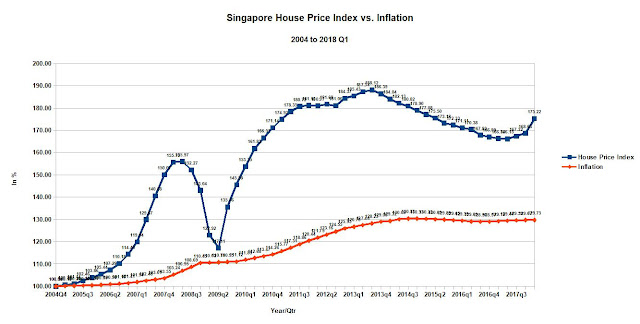
Singapore's home prices which have been declining for fourteen straight quarters, have resumed their upward trend. Home prices have rebounded by 9.00% off the low of 168.02 as of the second quarter of 2018. However, home prices are still  83.27% above their year-end 2004 levels. Overall prices levels, as measured by inflation have just increased by 29.87% since year end 2004.  In other words, for the past ten years, Singaporean home prices have outpaced inflation by more than 50 percentage points.


 Malaysia


Neighboring Malaysia's House Price Index now stands at 271.12 as of the first quarter 2018, 171.12% higher than year-end 1998 levels.  General price levels as of the fourth quarter 2017 are only around 55.59% higher than their year-end 1998 levels.


 Thailand


In Thailand, which has been experiencing political turmoil for some time, home prices have remained essentially flat since the end of 2004. Home Prices ended 2013 with the index at 100.54, just 0.54% higher than the end of 2004, but showing a substantial recovery since the recent low of 74.08 posted in the third quarter of 2009. In the second quarter of 2018, home prices have rebounded to 122.70, or 22.70% higher than its year-end 2004 levels, way below its expected inflation adjusted levels. General Price levels are 35.65% above their year-end 2004 levels. In other words, Thailand Home Prices have lagged inflation by as much as 12.95% since their year-end 2004 levels.


Indonesia


Meanwhile in Indonesia, home prices have showed no signs of slowing down their upward trajectory.  In fact, prices seem to have gone parabolic, climbing 4.63% in the last quarter of 2013, from a base of 121.49 as of the third quarter of 2013 to 127.11 as of year end 2013. In the first quarter of 2018, home prices have climbed an additional 25.47% to reach 152.58.  Since the first quarter of 2007, home prices have risen 52.58%, while inflation has raised general prices by 84.21% during the same period. Indonesian Home Prices, like Thailand, have lagged inflation since 2007.


Hong Kong

Hong Kong real estate prices have reached a staggering 465.25 as of the second quarter of 2018 from a base of 100 since year-end 2004. General inflation levels have just climbed 46.79% during this same period.  In other words, Hong Kong home prices have outpaced inflation by an astounding 318.46% during this period, the highest rate of appreciation in the countries covered in this post.

However, it is important to note that Hong Kong Home Prices have also entered into a minor correction phase, declining by 9.83% from its recent peak of 365.95 as of the third quarter of 2015 to just 329.38 as of the first quarter of 2016.  Although there was a distinct possibility that Hong Kong Home Prices entered a bear market just as it did in the aftermath of the 1997 Asian Financial Crisis, that possibility has now disappeared and the index is at an all-time high. See previous post: How low can Hong Kong Property Prices Go? Some Clues from the Not Too Distant Past

Philippines


Philippine house price index stands at 255.26 at the end of the second quarter 2018 or over 155.26% above their year-end 2004 levels.  Philippine home prices, with the exception of Hong Kong, have posted the largest 10-year gains among all the countries considered in this blog post.  Like Singapore and Malaysia, Philippine home prices have outstripped inflation by around seventy-eight percentage points.  Like Indonesia and Hong Kong, Philippine home prices have so far no signs of slowing down their upward trajectory for the foreseeable future.   The question is, is this momentum sustainable?  Or will the Philippines and Indonesia follow its ASEAN neighbors, Singapore, Malaysia, and Thailand, in exhibiting plateauing or declining house prices?  That remains to be seen.


Tuesday, July 31, 2018

Great Recession vs. Great Depression: Is the GDP Growth Rate Finally Speeding Up?

 Two months ago, we lamented on how the economic recovery of the Great Recession had become officially much slower than that of the Great Depression. Last week, the Bureau of Economic Analysis released an advance estimate of the GDP growth rate for the second quarter of 2018.  The good news? It's finally at 4.1%, a rate not seen since the third quarter of 2014.

Real GDP: Percent Change from Preceding Quarter


On a Nominal GDP Per Capita basis, the economic recovery of the Great Recession is still way ahead of the Great Depression. The dip in nominal GDP per capita was really shallow - less than 3 percentage points. The drop in GDP per capita during the Great Depression was a catastrophic 47%.

At this point in the economic recovery, some eleven years after the Great Recession started, we are almost 30% better than where we were. Where as during the Great Depression, nominal GDP per capita remained almost 10% below the depression's inception.

In terms of real GDP per capita, people were made whole only on 2013 of the Great Recession. Five years later, we are only 12% better than where we were in 2013.  During the Great Depression, people were only made whole, in terms of Real GDP Per Capita, only on year 10 of the Great Depression. But the recovery accelerated even faster. Just one year later, people were 8% better. That trend will accelerate in year 12 - by then, they will be almost 18% better than they were just one year earlier. Now where will we be one year from now? We don't know. So far, we are faring better than people of  the Great Depression, but just barely.


Thursday, July 26, 2018

Which Australian City Has the Most Unaffordable Real Estate? The Answer Might Surprise You.

We've all seen this chart. Next to New Zealand, Australia has one of the most overheated real estate markets in the entire world.


As of March 2018, Australian Home Prices have appreciated more than 83% above where they would be on an inflation-adjusted basis.


But which is the most overheated real estate market in Australia? It's definitely not Sydney. As it turns out, Sydney's price appreciation is below average. That honor goes to Melbourne, closely followed by Darwin, with Hobart and Perth fast catching up.


Amazingly, Darwin peaked way back in June 2014 - four years ago. It is now down more than 17% from that peak. The same holds true for Perth. Those markets have been in correction mode for years. At it's peak, Darwin home prices appreciated a full 156 percentage points above inflation. As of March 2018, the inflation gap for Darwin is down to only 99%. With an inflation gap of 117%, Melbourne is now the undisputed champion of unaffordable Australian real estate.


How about Sydney? Sydney's inflation gap is only 66%, substantially lower than the Eight City average of 77%.

Monday, July 9, 2018

If Filipinos Are Getting Richer, Why Are There Fewer Filipino Students in the USA Every Year? - Updated as of 2016-2017

If Filipinos are getting richer, why are there fewer and fewer Filipino students studying in the USA every year?


 According to the latest Open Doors Report, the number of Filipino students studying in US Colleges and Universities, at 3,066 students in 2016, is even lower than what it was in the year 2000: 3,139 students. However, this is a 4.16% increase over the previous year's total of 2,886 students.

This runs counter to the trend in the ASEAN. Other ASEAN countries, particularly Vietnam, have been enrolling more and more of their students in US Colleges and Universities.


If Filipinos Are Getting Richer, Why Are There Fewer Filipino Students in the USA Every Year?


The Mysterious Decline of Filipino Students in the US

Wednesday, May 30, 2018

Are ASEAN House Prices Accelerating? Is this the Blow Off Top in the ASEAN Real Estate Market?

Almost all countries discussed in this blog post, with the exception of Thailand, have been experiencing rapid growth in home prices that have outstripped inflation by a wide margin.  The gap between home prices and their inflation adjusted levels are at the widest ever, particularly in Singapore, Hong Kong, and the Philippines.

Singapore

Singapore's home prices which have been declining for fourteen straight quarters, have resumed their upward trend. Home prices have rebounded by 5.46% off the low of 166.15 as of the first quarter of 2018. However, home prices are still  75.22% above their year-end 2004 levels. Overall prices levels, as measured by inflation have just increased by 31.45% since year end 2004.  In other words, for the past ten years, Singaporean home prices have outpaced inflation by almost than 40 percentage points.


 Malaysia


Neighboring Malaysia's House Price Index now stands at 270.70 as of the fourth quarter 2017, 170.70% higher than year-end 1998 levels.  General price levels as of the fourth quarter 2017 are only around 54.89% higher than their year-end 1998 levels.


Thailand


In Thailand, which has been experiencing political turmoil for some time, home prices have remained essentially flat since the end of 2004. Home Prices ended 2013 with the index at 100.54, just 0.54% higher than the end of 2004, but showing a substantial recovery since the recent low of 74.08 posted in the third quarter of 2009. In the first quarter of 2018, home prices have rebounded to 122.61, or 22.61% higher than its year-end 2004 levels, way below its expected inflation adjusted levels. General Price levels are 35.20% above their year-end 2004 levels. In other words, Thailand Home Prices have lagged inflation by as much as 12.59% since their year-end 2004 levels.


Indonesia


Meanwhile in Indonesia, home prices have showed no signs of slowing down their upward trajectory.  In fact, prices seem to have gone parabolic, climbing 4.63% in the last quarter of 2013, from a base of 121.49 as of the third quarter of 2013 to 127.11 as of year end 2013. In the first quarter of 2018, home prices have climbed an additional 25.47% to reach 152.58.  Since the first quarter of 2007, home prices have risen 52.58%, while inflation has raised general prices by 84.21% during the same period. Indonesian Home Prices, like Thailand, have lagged inflation since 2007.


Hong Kong

 
Hong Kong real estate prices have reached a staggering 446.68 as of the first quarter of 2018 from a base of 100 since year-end 2004. General inflation levels have just climbed 47.18% during this same period.  In other words, Hong Kong home prices have outpaced inflation by an astounding 29.50% during this period, the highest rate of appreciation in the countries covered in this post.

However, it is important to note that Hong Kong Home Prices have also entered into a minor correction phase, declining by 9.83% from its recent peak of 365.95 as of the third quarter of 2015 to just 329.38 as of the first quarter of 2016.  Although there was a distinct possibility that Hong Kong Home Prices entered a bear market just as it did in the aftermath of the 1997 Asian Financial Crisis, that possibility has now disappeared and the index is at an all-time high. See previous post: How low can Hong Kong Property Prices Go? Some Clues from the Not Too Distant Past


Philippines


Philippine house price index stands at 248.31 at the end of the first quarter 2018 or over 148.31% above their year-end 2004 levels.  Philippine home prices, with the exception of Hong Kong, have posted the largest 10-year gains among all the countries considered in this blog post.  Like Singapore and Malaysia, Philippine home prices have outstripped inflation by around seventy-eight percentage points.  Like Indonesia and Hong Kong, Philippine home prices have so far no signs of slowing down their upward trajectory for the foreseeable future.   The question is, is this momentum sustainable?  Or will the Philippines and Indonesia follow its ASEAN neighbors, Singapore, Malaysia, and Thailand, in exhibiting plateauing or declining house prices?  That remains to be seen.


 Global Property Guide, Trading Economics, World Bank, Colliers International Philippines

Tuesday, May 22, 2018

It's Official: The Current Economic Recovery is Now Much Slower Than That of the Great Depression

There's no doubt about it. The economic decline of the Great Depression was extremely severe. Nominal GDP per capita decline by almost 50% during the Great Depression versus a slightly more than 2% decline in Nominal GDP per capita during the Great Recession. Eleven years after the start of the Great Depression, Nominal GDP per capita was still almost 10% lower. In the Great Recession, it is 27.01% higher.


However, economic growth rates during the Great Depression were much more robust than that of the Great Recession, both on an absolute basis and on a per capita basis.


In truth, the economic recovery of the Great Recession has been almost imperceptible to most Americans. On a per capita bais, real GDP per Capita grew by 7.66% in the past eleven years - or roughly a compounded annual average growth rate of only 0.67% per annum. This is far less than the so-called "Hindu Rate of Growth" threshold of 1.30% per annum.  This growth rate is so slow that it is almost imperceptible.


In 2018, something extraordinary happened. Those who survived the Great Depression in 1940 (eleven years after the onset of the Great Depression) will be substantially better of than the survivors of the Great Recession in 2018. Real GDP Per Capita for Great Recession survivors would have grown by another anemic 0.67% per annum in 2018. But for survivors of the Great Depression era, their incomes per capita would have grown by an astounding 7.75% in just one year. Moreover, that trend will only accelerate in the next three years. By 1943, Great Depression survivors will be almost 56%  richer than they were in 1940.

Can we expect the same for survivors of the Great Recession in the next three years? It's possible but not probable.


Previous Post: The American Rate of Growth 

 Great Depression vs. Great Recession